
Jacques Bertin is a pioneering figure in visual communication. It says something about how relatively young this field is to note that his most influential book - Semiology of Graphics - was published less than fifty years ago. We've been communicating visually for a bit longer than that, but not that many people were thinking about the topic methodically. As someone who loves & appreciates maps, I'm not surprised that Bertin was a cartographer. Map guys established many of the principles of the field, and still create some of the best work.
So, let me pick on the color-coded-US-map once again to make a point. A US map, divided by state boundaries, represents geography - right? If we fill in the states with colors to show something else - votes, populace, incidents of Scottish Terriers, whatever - we run into a conflict. Wyoming doesn't have that many Scottish Terriers (I think), but Wyoming is big, so we won't really understand the Scottish Terrier population accurately.
Bertin recognized the problem with cloropleth visuals (shaded/color-coded maps), and suggested an alternative called the Dot Grid. It's quite elegant.
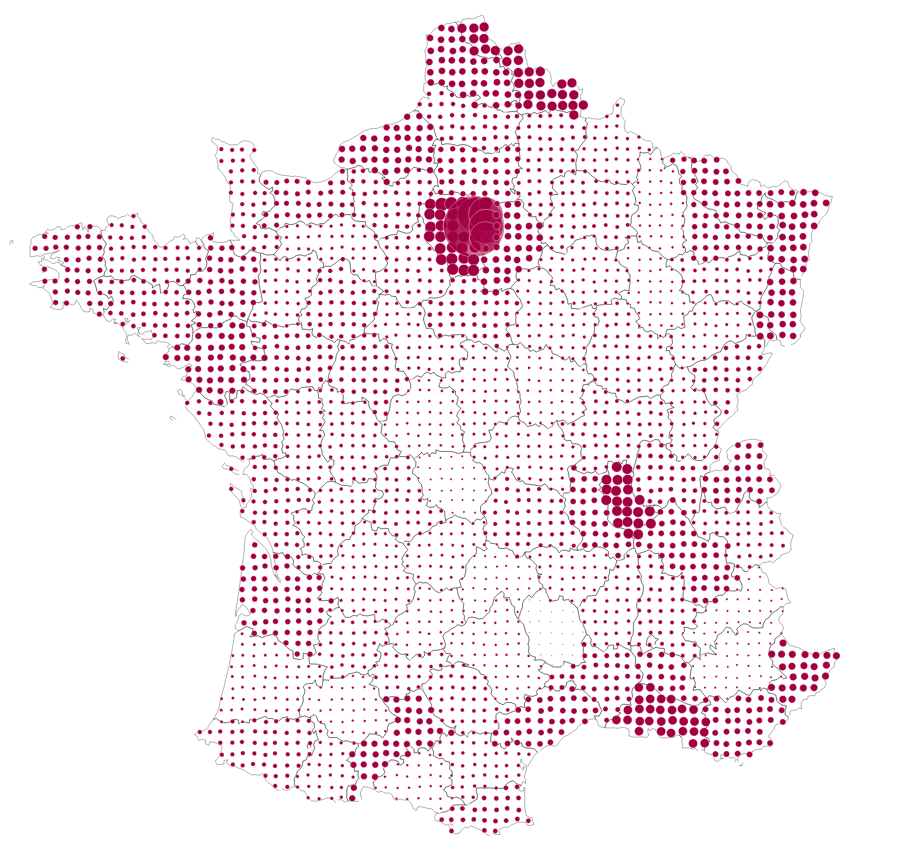
What nation does this map represent?
What do the dots represent?
You probably knew both answers without labels, and I'll bet you commented on the population of the capitol as well.
"Elegance is a synonym for beautiful that has come to acquire the additional connotations of unusual effectiveness and simplicity."
Thanks, anonymous Wikipedia author. It's the right word for this technique. It is simple, but it enables a reader to make sense of two unrelated things simultaneously, resulting in additional knowledge. That's a pretty powerful thing. Yes, a priori knowledge plays a role - if you ignored geography class you might have no clue what country that is. (Here's hoping that we have a much more geographically literate populace in the years to come, thanks to Google Earth et al.)
I particularly appreciate the no-labels-required aspect of the technique. There's no key explaining the dot size - you don't need it. You're perfectly able to compare sizes, almost instantly, and with a high degree of accuracy. You can make comparisons between 94 different double-coded (area + populace) entities, or focus in on a subset with a sense of context to make further meaning.
All that from a bunch of dots. Isn't that cool!
--md